A Cloud-web service for mapping pluvial/flash-flood hazard and risk in urban areas
With the increase of urbanization, conditions of the underlying surface and climate have been changed by human activities. This results in more frequent flooding and inundation problems in urban areas. Storm- inundation models based on hydrology and hydrodynamics require a large amount of input data (detailed terrain, sewer system and land use data). Simulation models are complex and difficult to build and run.
On the other side, upcoming availability of high resolution topography data (Lidar/DEM) together with advanced GIS/Geospatial spatial processing tools, permits to develop more efficient, accurate and simplified modelling approaches.
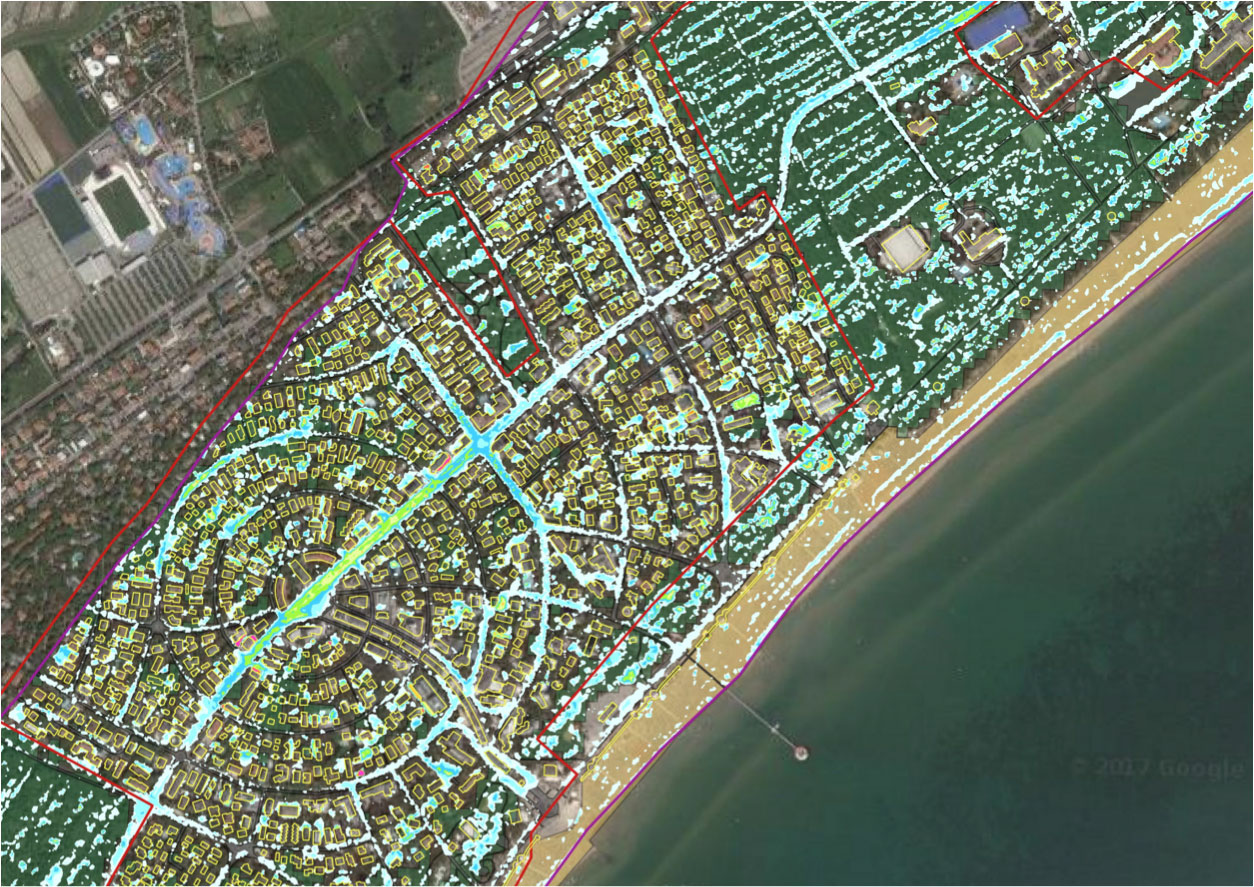
URBAN_SmartFLOOD is a simplified raster-based model for quickly mapping Pluvial/Flash-flood hazard and risk in urban area with a DEM-based depression-to-depression filling, spilling and merging process.
URBAN_SmartFLOOD algorithm computes and maps the areas of a terrain that are flooded in a given flash flood event by simulating how water flows on the terrain and fills up depressions.
The URBAN_SmartFLOOD Web Service is designed to provides end-users with the possibility to consistently and cost-effectively run in real-time flood hazard mapping related to specific pluvial scenarios and to support the design of resilience and adaptation plans in urban areas.

The service covers the needs of Public Authorities seeking for a comprehensive, cost effective tool for quickly mapping flash-flood in Cities and for planning and designing mitigation and adaptation measures (nature-based solution) for more resilient cities. It also attends to the needs of single users (consultancies firms) seeking for local high detailed maps in data scarce regions where numerical modeling may not be feasible
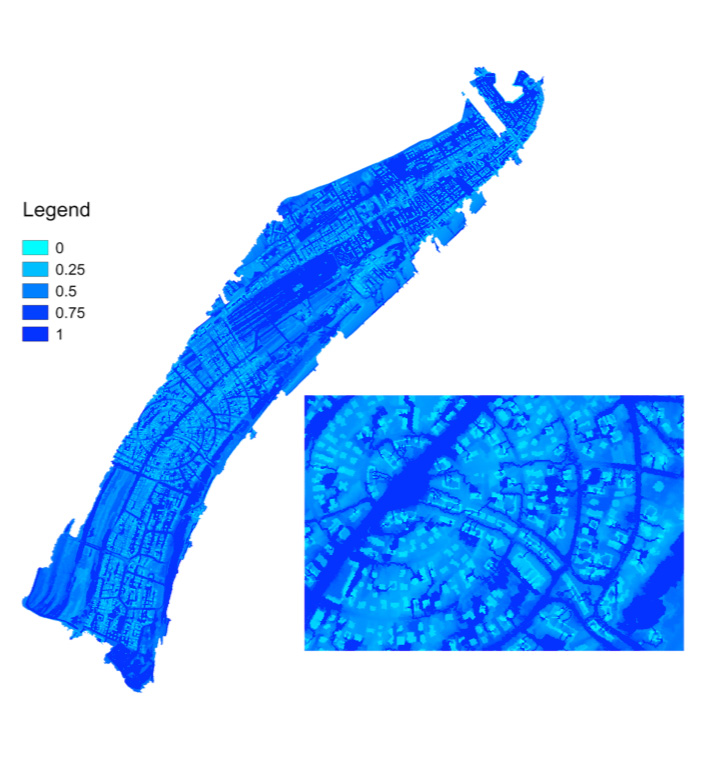
The URBAN_SmartFLOOD algorithms is a kind of simplified distributed hydrologic model based on DEM, in this method, depressions in the terrain are regarded as the basic inundated area. The amount of water that can be stored in a depression indicates the final inundation distribution. The runoff catchment area and maximum storage volume of a depression, and the flow direction between these depressions are all considered in the final inundation simulation.
GIS and raster-based technology is used to find the depressions in an area, divide the sub-catchment for each depression, and obtain the flow order of the depressions based on a digital elevation model (DEM). In case of partial filling a specific level-set depression hierarchy methods has been implemented (Wu et al. 2017)
Assumptions:
- This model doesn’t solve hydrodynamic equations in terms of mass and momentum but simply assess the flood extent and water depth propagating water level across depressions of a DEM/LIDAR in urban area.
- assumes that the terrain is an impermeable surface. This may change in a later version (ex. reducing the precipitation amount).
- does not know the concept of time. This means that the capacity of surface streams is infinite no matter the width or depth. Streams won’t flow over along their sides. The end result is the situation after infinite time, when all water has reached its final destination.
- Water flows from one cell to one other neighbour cell (the D8 method).
- The DEM used must cover an entire drainage basin (or more basins) in order to estimate correct stream flows from all upstream sub-watersheds within the basins